Working with tables
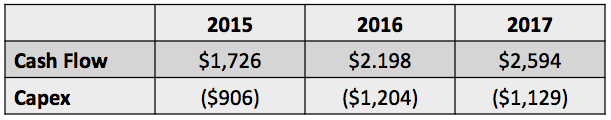
PowerPoint allows text and numbers to be presented in tabular form (aligned rows and columns) in a reasonably flexible way. A PowerPoint table is not nearly as functional as an Excel spreadsheet, and is definitely less powerful than a table in Microsoft Word, but it serves well for most presentation purposes.
Concepts
There are a few terms worth reviewing as a basis for understanding PowerPoint tables:
- table
A table is a matrix of cells arranged in aligned rows and columns. This orderly arrangement allows a reader to more easily make sense of relatively large number of individual items. It is commonly used for displaying numbers, but can also be used for blocks of text.
- cell
An individual content “container” within a table. A cell has a text-frame in which it holds that content. A PowerPoint table cell can only contain text. I cannot hold images, other shapes, or other tables.
A cell has a background fill, borders, margins, and several other formatting settings that can be customized on a cell-by-cell basis.
- row
- A side-by-side sequence of cells running across the table, all sharing the same top and bottom boundary.
- column
- A vertical sequence of cells spanning the height of the table, all sharing the same left and right boundary.
- table grid, also cell grid
- The underlying cells in a PowerPoint table are strictly regular. In a three-by-three table there are nine grid cells, three in each row and three in each column. The presence of merged cells can obscure portions of the cell grid, but not change the number of cells in the grid. Access to a table cell in python-pptx is always via that cell’s coordinates in the cell grid, which may not conform to its visual location (or lack thereof) in the table.
- merged cell
A cell can be “merged” with adjacent cells, horizontally, vertically, or both, causing the resulting cell to look and behave like a single cell that spans the area formerly occupied by those individual cells.
- merge-origin cell
- The top-left grid-cell in a merged cell has certain special behaviors. The
content of that cell is what appears on the slide; content of any “spanned”
cells is hidden. In python-pptx a merge-origin cell can be identified with the
_Cell.is_merge_originproperty. Such a cell can report the size of the merged cell with itsspan_heightandspan_widthproperties, and can be “unmerged” back to its underlying grid cells using itssplit()method. - spanned-cell
- A grid-cell other than the merge-origin cell that is “occupied” by a merged
cell is called a spanned cell. Intuitively, the merge-origin cell “spans”
the other grid cells within its area. A spanned cell can be identified with
its
_Cell.is_spannedproperty. A merge-origin cell is not itself a spanned cell.
Adding a table
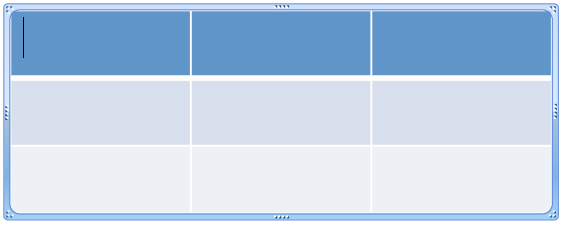
The following code adds a 3-by-3 table in a new presentation:
>>> from pptx import Presentation
>>> from pptx.util import Inches

>>> # ---create presentation with 1 slide---
>>> prs = Presentation()
>>> slide = prs.slides.add_slide(prs.slide_layouts[5])

>>> # ---add table to slide---
>>> x, y, cx, cy = Inches(2), Inches(2), Inches(4), Inches(1.5)
>>> shape = slide.shapes.add_table(3, 3, x, y, cx, cy)

>>> shape
<pptx.shapes.graphfrm.GraphicFrame object at 0x1022816d0>
>>> shape.has_table
True
>>> table = shape.table
>>> table
<pptx.table.Table object at 0x1096f8d90>
A couple things to note:
SlideShapes.add_table()returns a shape that contains the table, not the table itself. In PowerPoint, a table is contained in a graphic-frame shape, as is a chart or SmartArt. You can determine whether a shape contains a table using itshas_tableproperty and you access the table object using the shape’stableproperty.
Inserting a table into a table placeholder
A placeholder allows you to specify the position and size of a shape as part of the presentation “template”, and to place a shape of your choosing into that placeholder when authoring a presentation based on that template. This can lead to a better looking presentation, with objects appearing in a consistent location from slide-to-slide.
Placeholders come in different types, one of which is a table placeholder. A table placeholder behaves like other placeholders except it can only accept insertion of a table. Other placeholder types accept text bullets or charts.
There is a subtle distinction between a layout placeholder and a slide placeholder. A layout placeholder appears in a slide layout, and defines the position and size of the placeholder “cloned” from it onto each slide created with that layout. As long as you don’t adjust the position or size of the slide placeholder, it will inherit it’s position and size from the layout placeholder it derives from.
To insert a table into a table placeholder, you need a slide layout that includes a table placeholder, and you need to create a slide using that layout. These examples assume that the third slide layout in template.pptx includes a table placeholder:
>>> prs = Presentation('template.pptx')
>>> slide = prs.slides.add_slide(prs.slide_layouts[2])
Accessing the table placeholder. Generally, the easiest way to access a placeholder shape is to know its position in the slide.shapes collection. If you always use the same template, it will always show up in the same position:
>>> table_placeholder = slide.shapes[1]
Inserting a table. A table is inserted into the placeholder by calling its
insert_table() method and providing the desired
number of rows and columns:
>>> shape = table_placeholder.insert_table(rows=3, cols=4)
The return value is a GraphicFrame shape containing the new table, not the
table object itself. Use the table property of that
shape to access the table object:
>>> table = shape.table
The containing shape controls the position and size. Everything else, like accessing cells and their contents, is done from the table object.
Accessing a cell
All content in a table is in a cell, so getting a reference to one of those is a good place to start:
>>> cell = table.cell(0, 0)
>>> cell.text
''
>>> cell.text = 'Unladen Swallow'
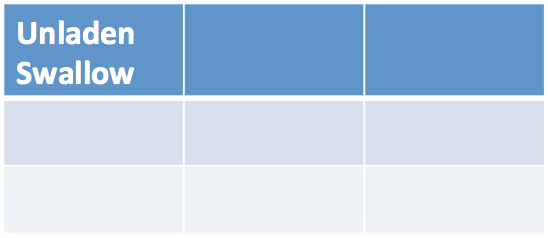
The cell is specified by its row, column coordinates as zero-based offsets. The top-left cell is at row, column (0, 0).
Like an auto-shape, a cell has a text-frame and can contain arbitrary text divided into paragraphs and runs. Any desired character formatting can be applied individually to each run.
Often however, cell text is just a simple string. For these cases the
read/write _Cell.text property can be the quickest way to set cell
contents.
Merging cells
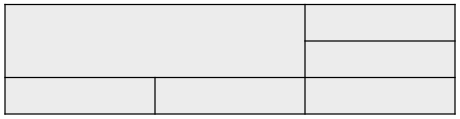
A merged cell is produced by specifying two diagonal cells. The merged cell will occupy all the grid cells in the rectangular region specified by that diagonal:

>>> cell = table.cell(0, 0)
>>> other_cell = table.cell(1, 1)
>>> cell.is_merge_origin
False
>>> cell.merge(other_cell)
>>> cell.is_merge_origin
True
>>> cell.is_spanned
False
>>> other_cell.is_spanned
True
>>> table.cell(0, 1).is_spanned
True
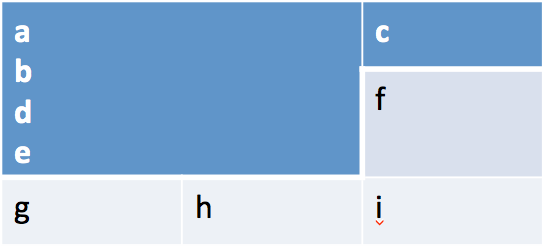
A few things to observe:
- The merged cell appears as a single cell occupying the space formerly occupied by the other grid cells in the specified rectangular region.
- The formatting of the merged cell (background color, font etc.) is taken from the merge origin cell, the top-left cell of the table in this case.
- Content from the merged cells was migrated to the merge-origin cell. That content is no longer present in the spanned grid cells (although you can’t see those at the moment). The content of each cell appears as a separate paragraph in the merged cell; it isn’t concatenated into a single paragraph. Content is migrated in left-to-right, top-to-bottom order of the original cells.
- Calling
other_cell.merge(cell)would have the exact same effect. The merge origin is always the top-left cell in the specified rectangular region. There are four distinct ways to specify a given rectangular region (two diagonals, each having two orderings).
Un-merging a cell
A merged cell can be restored to its underlying grid cells by calling the
split() method on its merge-origin cell. Calling
split() on a cell that is not a merge-origin raises
ValueError:
>>> cell = table.cell(0, 0)
>>> cell.is_merge_origin
True
>>> cell.split()
>>> cell.is_merge_origin
False
>>> table.cell(0, 1).is_spanned
False
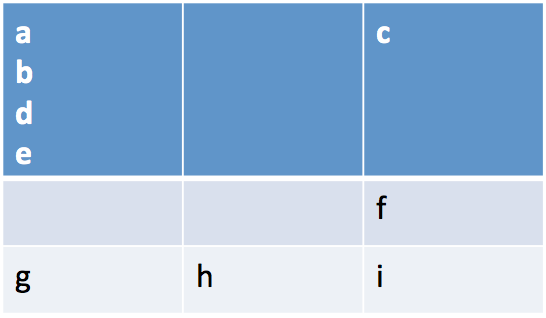
Note that the content migration performed as part of the .merge() operation was not reversed.
A few snippets that might be handy
Use Case: Interrogate table for merged cells:
def iter_merge_origins(table):
    """Generate each merge-origin cell in *table*.

    Cell objects are ordered by their position in the table,
    left-to-right, top-to-bottom.
    """
    return (cell for cell in table.iter_cells() if cell.is_merge_origin)

def merged_cell_report(cell):
    """Return str summarizing position and size of merged *cell*."""
    return (
        'merged cell at row %d, col %d, %d cells high and %d cells wide'
        % (cell.row_idx, cell.col_idx, cell.span_height, cell.span_width)
    )

# ---Print a summary line for each merged cell in *table*.---
for merge_origin_cell in iter_merge_origins(table):
    print(merged_cell_report(merge_origin_cell))
prints a report like:
merged cell at row 0, col 0, 2 cells high and 2 cells wide
merged cell at row 3, col 2, 1 cells high and 2 cells wide
merged cell at row 4, col 0, 2 cells high and 1 cells wide
Use Case: Access only cells that display text (are not spanned):
def iter_visible_cells(table):
    return (cell for cell in table.iter_cells() if not cell.is_spanned)
Use Case: Determine whether table contains merged cells:
def has_merged_cells(table):
    for cell in table.iter_cells():
        if cell.is_merge_origin:
            return True
    return False